
Writing
OpenIndiana Installation walkthrough - Part 4
This is Part 4 of a series of posts explaining how to configure OpenIndiana as NAS storage device. The series is made up of the following parts:
- Background information about OpenIndiana and OS installation
- Network configuration and Setting up storage
- Presenting storage to your Hosts with iSCSI and/or NFS
- Performance testing
Today we will go into the performance I was able to get out of the OpenIndiana appliance that I have installed.
But first a small bit of detail around the hardware setup this is actually running on.
This a lab – therefore the setup is not optimal.
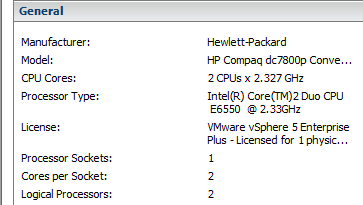
I am using an HP DC7800 PC for an ESXi imagehost. The PC can hold 4 SATA devices and up to 8GB of RAM. I also have 2 hard disks in the Host – 1 Western Digital Caviar Blue WD2500AAKS 250GB 7200 RPM 16MB Cache SATA 3.0Gb/s 3.5" where I have ESX installed and use as a local storage, and also 1 Intel® Solid-State Drive 520 Series – 180GB. And on this drive I have installed OpenIndiana.
The setup was identical to the walkthrough from the previous stages, with some exceptions.
The VM has 10 VMDK’s attached to it – each 15GB in size and they are all connected to a separate SCSI adapter (SCSI1).
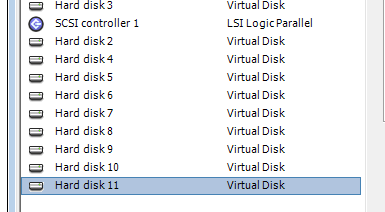
I then created a RAIDZ1 volume of all of these disks and presented this as both NFS and iSCSI storage.
root@nas1:~# zpool list -v
NAME          SIZE  ALLOC   FREE  EXPANDSZ    CAP  DEDUP  HEALTH  ALTROOT
disk1         146G  66.1G  79.9G         -    45%  1.00x  ONLINE  -
  raidz1      146G  66.1G  79.9G         -
    c4t0d0       -      -      -         -
    c4t1d0       -      -      -         -
    c4t2d0       -      -      -         -
    c4t3d0       -      -      -         -
    c4t4d0       -      -      -         -
    c4t5d0       -      -      -         -
    c4t6d0       -      -      -         -
    c4t8d0       -      -      -         -
    c4t9d0       -      -      -         -
    c4t10d0      -      -      -         -

root@nas1:~# zfs list
NAME                       USED  AVAIL  REFER  MOUNTPOINT
disk1                      103G  25.1G  51.9K  /disk1
disk1/iscsi_1              103G  69.4G  58.8G  -
disk1/nfs_1                317M  25.1G   317M  /disk1/nfs_1
rpool                     6.30G  5.45G  45.5K  /rpool
rpool/ROOT                3.20G  5.45G    31K  legacy
rpool/ROOT/openindiana    10.6M  5.45G  1.95G  /
rpool/ROOT/openindiana-1   816M  5.45G  1.87G  /
rpool/ROOT/openindiana-2  2.39G  5.45G  1.96G  /
rpool/dump                1.50G  5.45G  1.50G  -
OpenIndiana has 3 NICs (eth0-2) where eth1 & eth2 are used for iSCSI traffic and eth2 is used for NFS traffic (the reason being I wanted to check the multipathing options)
The Openindiana VM was configured with two configurations. 2GB RAM and 4GB RAM. The test I performed was Max IOPs (512b block 0% Random – 100% Read) from VMware’s I/O Analyzer 1.1.
The tests were done on:
- Native SSD (not through OpenIndiana)
- iSCSI LUN
- NFS mount
And here are the results
Native SSD
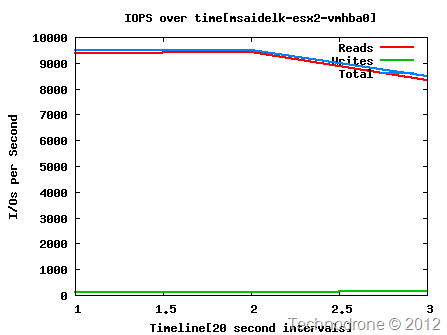
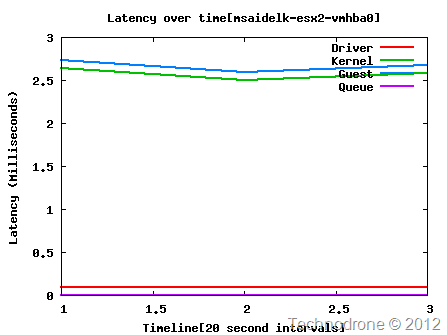
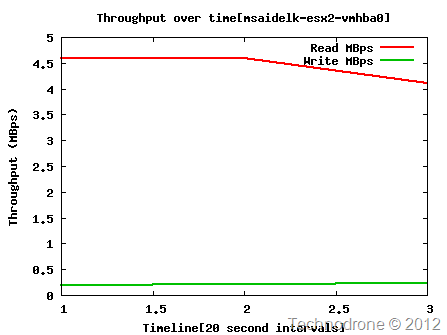
Maximum IOPs 9,364.23 with ~2.6 ms latency



NFS
Maximum IOPs 9,364.23 with ~2.6 ms latency


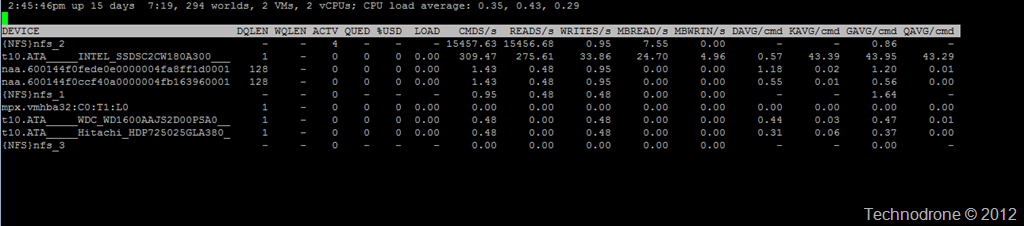
The interesting thing you may notice here about the last graphic – is that the NFS disk is actually pushing a large amount of IO requests but the underlying physical disk is actually not really working very hard.
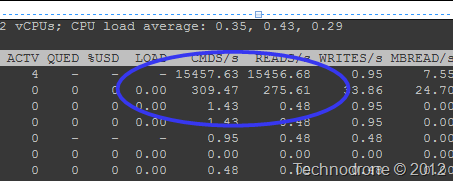
Memory\Kernel MBytes913
Memory\NonKernel MBytes2461
Group Cpu(416665:nas2)\% Used64.2
Network Port(vSwitch2:50331656:vmk3)\MBits Received/sec85.5
iSCSI
Maximum IOPs 14,331 with ~1.3 ms latency


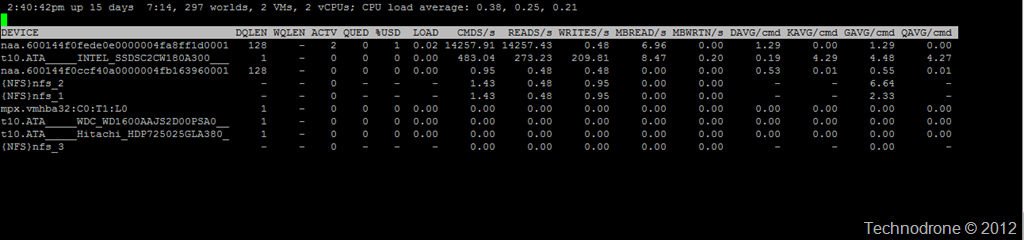
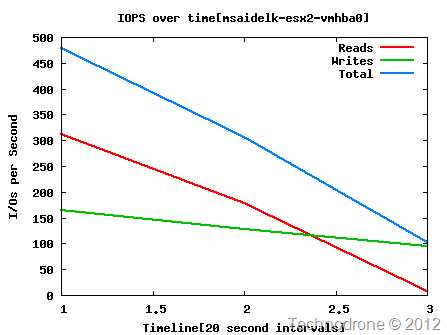
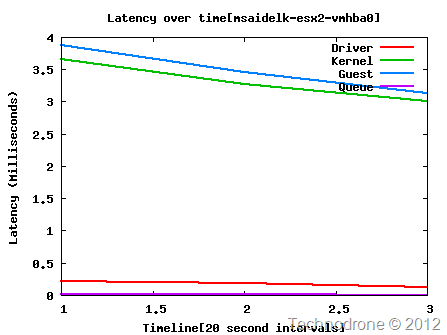
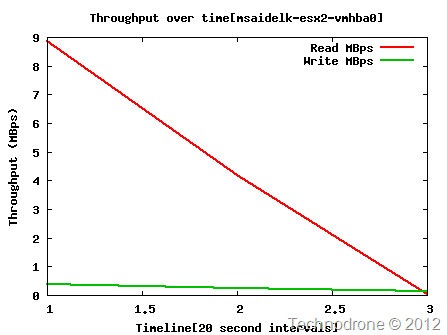
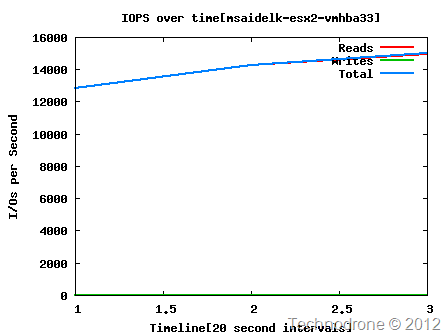
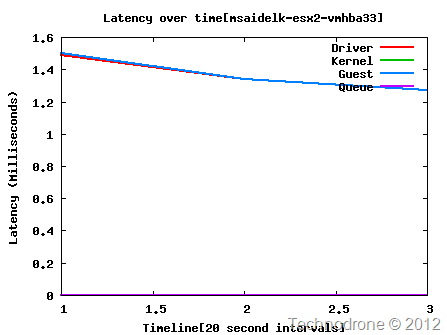
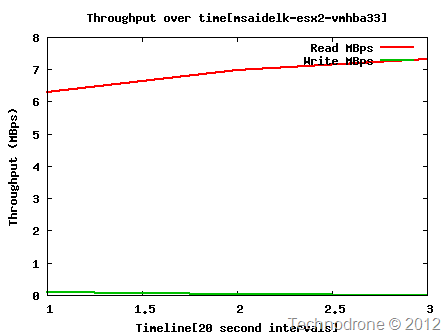
Again note the actual IO to the SSD
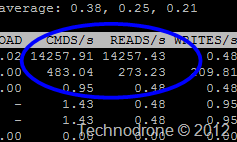
The numbers are quite impressive as you can see.
What I learned from this:
- NFS/iSCSI performance was very much the same – besides the fact the NFS put a much higher load on the OpenIndiana server than iSCSI did (something like 60 times more CPU usage!)
- The performance achieved through OpenIndiana was higher than native disk – due to the fact that OpenIndiana makes use of RAM as a caching mechanism.
My apologies for the delay in the last part of this series.