Benchmarking your Disk I/O
How fast is your storage? How do you even check what kind of throughput you are getting?
That is a question that comes up often enough, when performing benchmarks.
I actually dealt with such a case last week. The customer was performing a storage Migration of all their VM’s from an HP MSA Array to a NetApp Filer. In order to ensure that no decrease in performance was experienced, I needed to benchmark the the disk I/O before and after the migration.
There is an “unofficial storage performance thread” which is on the VMTN forums. This is actually an follow up on a even older thread that started way back in February 2007.
The principle is the same.
-
Prepare a Windows VM. This VM does not need anything specific in it, so a basic install will do just fine.
-
Add a Second Disk to the VM (10GB will do fine)
-
Format the new Drive with NTFS.
-
Download Iometer - according to your operating system (32/64 bit)
-
Download the Unofficial performance config test file
-
Extract the zip file. Copy the Dynamo.exe and IOmeter.exe files (located under the .\iometer-2008-06-22-rc2.win.32\iometer-2008-06-22-rc2\src\Release folder) to your VM
-
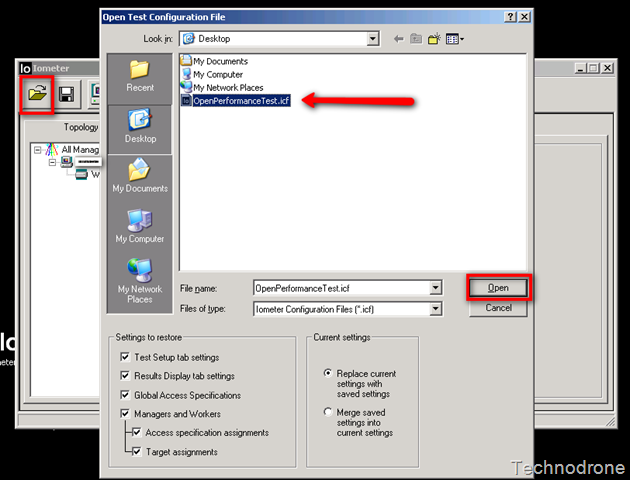
Copy the OpenPerformanceTest.icf file you downloaded in Step 5 to the VM.
-
Double click on the IOmeter file.
-
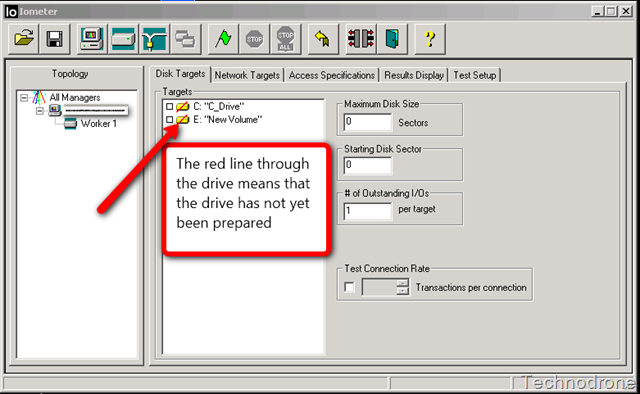
You will be presented with a window like this below
-
Click on the folder icon to load the config file for the test and point it to the OpenPerformanceTest.icf
-
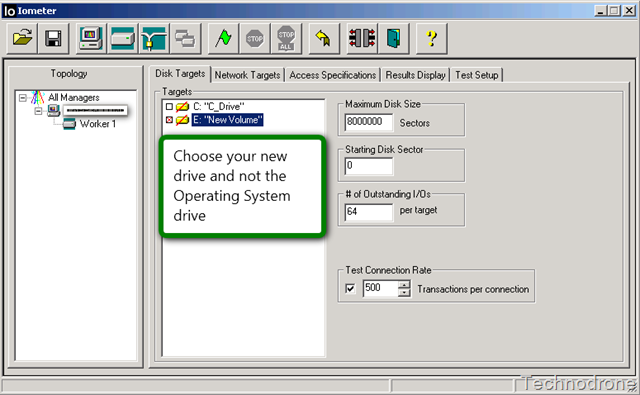
Choose your newly created drive that formatted in Step 3
-
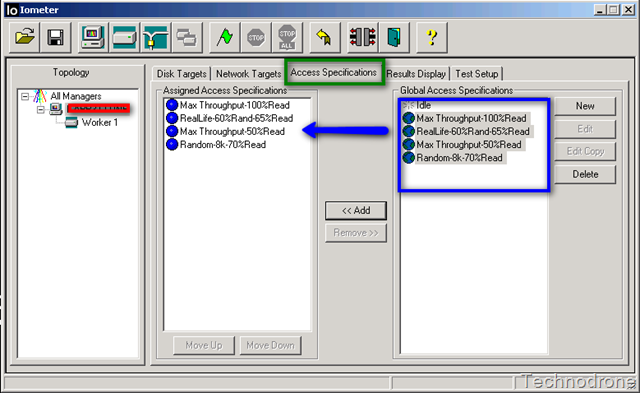
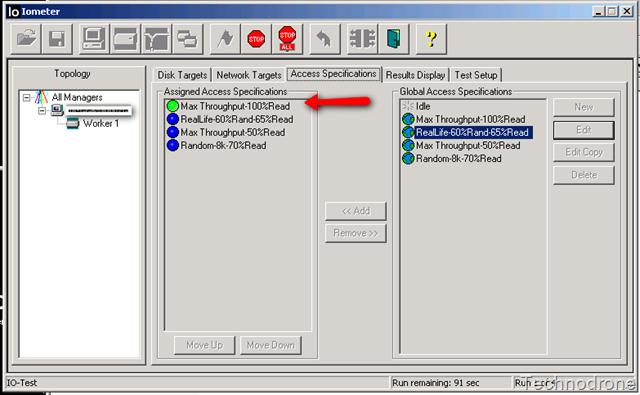
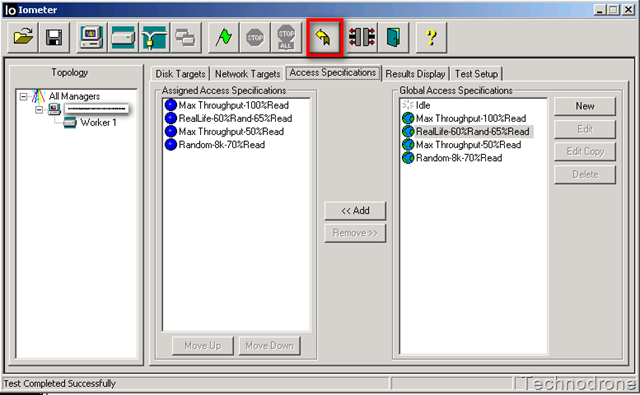
Click the Access Specifications Tab and add the bottom four tests to the Assigned Access Specifications
You can if you would like click on edit to see what each of these specifications will test - and customize to your liking if need be.
-
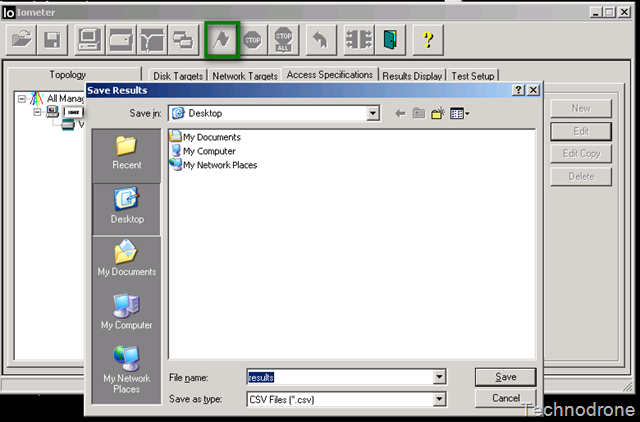
Click the green flag to start the test.
-
You will be asked for the to save the file.
-
IOmeter will then begin to prepare the drive.
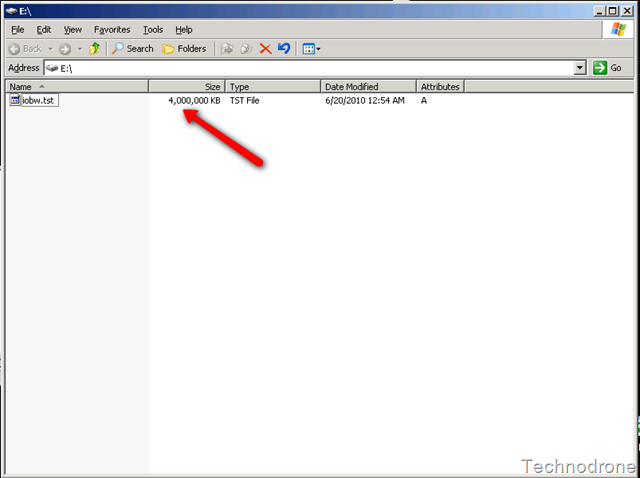
What does that mean. IOmeter will create a file in the root of the drive you selected (approximately
4 GB, that is why 10GB is more than enough, and then perform the tests on that file).This can take a while but let the process run.
-
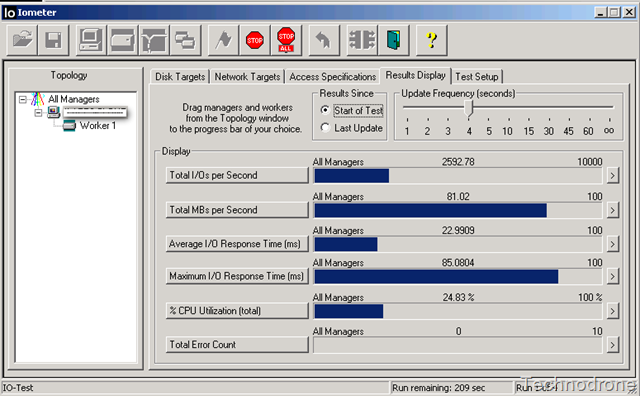
Once the preparation is complete the tests will run, each test for 5 minutes. During that time you can see the real-time results by choosing the results Display tab
-
You can see which test is currently running at that time by clicking the Access Specifications Tab
-
Once the tests are finished (20 minutes) you will be presented with a CSV file.
-
Open that file in Excel.
The interesting columns that you would like to use (if you want to compare to others in the thread) are:
G, J, O and AT (IOps, MBps, Ave Response Time, % CPU Utilization)- IOps - The Average # of IOps achieved / sec
- MBps - Throughput in MBps
- Ave. Response Time - Average response time in ms
- % CPU Utilization - How much of the vCPU was utilized in %.
-
I usually run the test 3 times - and collect the average of the three.
-
The next time you run the test - you will not have to wait to prepare the drives be cause the file is already there.
-
To clear the results click on reset workers button
-
Start again at Step 9.
Share your findings with others in the community by posting your results to the
unofficial storage performance thread
Update(25-Jun-10): As a result of he discussions based on the comments of this post and with the generous help of Didier Pironet of DeinosCloud - I am adding below a more “real-life” configuration test file for IOmeter.
Didier prepared this Config file according to HOWTO - Benchmark an iSCSI target (and any block target, including within VMs living in NFS datastores) from Chad Sakacc.
The specs are pretty clear and divided in 4 groups: Regular NTFS, Exchange, SQL and backup/restore
4K; 100% Read; 0% random (Regular NTFS Workload 1)
4K; 75% Read; 0% random (Regular NTFS Workload 2)
4K; 50% Read; 0% random (Regular NTFS Workload 3)
4K; 25% Read; 0% random (Regular NTFS Workload 4)
4K; 0% Read; 0% random (Regular NTFS Workload 5)

8K; 100% Read; 0% random (Exchange Workload 1)
8K; 75% Read; 0% random (Exchange Workload 2)
8K; 50% Read; 0% random (Exchange Workload 3)
8K; 25% Read; 0% random (Exchange Workload 4)
8K; 0% Read; 0% random (Exchange Workload 5)
8K; 50% Read; 50% random (Exchange Workload 6)

64K; 100% Read; 100% sequential (SQL Workload 1)
64K; 100% Write: 100% sequential (SQL Workload 2)
64K; 100% Read; 100% Random (SQL Workload 3)
64K; 100% Write: 100% Random (SQL Workload 4)

256K; 100% Read; 100% sequential (Backup)
256K; 100% Write100% sequential (Restore)
Those two specs below don’t mimic any Operating Systems/Applications behavior. It just tells you the maximum IOPS the storage can supply.
512B: 100% Read: 0% random (Max Read IOPS)
512B: 100% Write: 0% random (Max Write IOPS)
